

I am studying Nordic countries (Denmark, Finland, Iceland, Norway, Sweden) at Freedom University. I joined the first session on Wednesday and I learned about the outline of creativity and three viewpoints to know Nordic countries. A lecturer Yuriko Shibayama and a curator Kensuke Iwai instructed to our twenty attendees. This time, I would like to write about the Global Creativity Index 2015 which is one of the impressive theme in the session that the lecturer introduced.
The Global Creativity Index, or GCI
GCI is a broad-based measure for advanced economic growth and sustainable prosperity based on economic development – talent, technology, and tolerance (Florida, Mellander, & King, 2015). Regarding the overall ranking, Australia takes the number one ranking, United States is second, New Zealand is third, Canada fourth and five Nordic counties rank all by 11th. However, Japan is 24th. It seems technology is high but talent and tolerance are challenging.
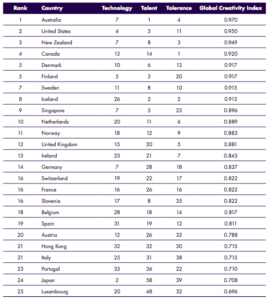
Fig 1. Top 25 Countries on the Global Creativity Index
Global Creative Class
The creative class includes workers in science and technology and engineering; arts, culture, entertainment, and the media; business and management; and education, healthcare, and law (Florida, Mellander, & King, 2015). Luxembourg has the largest share of the creative class (54%), Bermuda is second (48%), Singapore third (47%). Nordic countries are also ranked high, but Japan is 64th (19%). I think there is a possibility to boost up economic production and wage in Japanese creative class and to interact between Japanese creative classes.
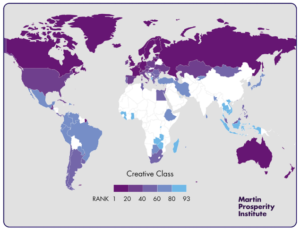
Fig 2. The global creative class map
Creativity, Competitiveness and Prosperity
Global creativity, as measured by the GCI, is closely connected to the economic development, competitiveness, and prosperity of nations (Florida, Mellander, & King, 2015). The scatter graph (Fig 3) shows how individual nations lineup in terms of the connection between the GCI and GDP per capita.
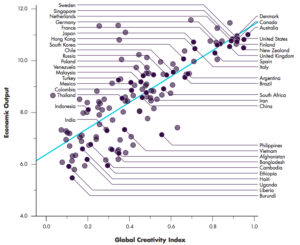
Fig 3. The GCI and economic output
Fig 4 shows the relationship between the GCI and economic competitiveness. The measure of competitiveness is based on the World Economic Forum’s Global Competitiveness Index. The line slopes steeply upward showing the close connection between the two. In the upper right hand corner of the graph, we find Singapore, the United States, Canada, Finland, Denmark, New Zealand, and Australia.
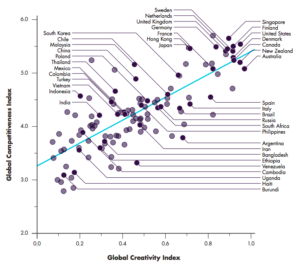
Fig 4. The GCI and global competitiveness
Entrepreneurship is a key factor in competitiveness. The measure of entrepreneurship is based on the Global Entrepreneurship Index.
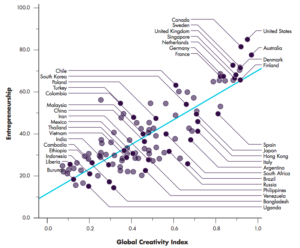
Fig 5. The GCI and global entrepreneurship
Japan has high GDP per capita and competitiveness, however its relationship with GCI tends to somewhat weak and entrepreneurship also tends to be inferior compared with the upper right hand corner countries, like United States, Canada, Australia, Sweden, Denmark, and Finland. Along with economic growth, I would like to think about how to make my daily life more creative.
References
- Florida, R., Mellander, C., & King, K. (2015). The Global Creativity Index 2015. Retrieved from http://martinprosperity.org/content/the-global-creativity-index-2015/
- Florida, R., Mellander, C., & King, K. (2015). The Global Creativity Index 2015. p14, p25-27, p58-60. Retrieved from http://martinprosperity.org/media/Global-Creativity-Index-2015.pdf
- Shibayama, Y. (2018). Creative City Nordic Studies at Freedom University. https://freedom-univ.com/lecture/nordic.html/